
CHALLENGE: improve the performance of a WordPress website
SOLUTION: apply easy-to-implement WP adjustments that provide the highest performance boost
Let’s discuss the difficult art of making a site work faster. There are multiple articles and tutorials with interesting tips for page speed improvement. However, the proposed solutions are often difficult to implement or not suitable for a standard WordPress CMS website. We’re going to suggest fast and easy WordPress optimization tips. The goal is to do minimal amounts of work and gain maximum performance.
Universal WP speed boosters
Every WordPress website is different, but there are common traits: WP architecture imposes certain solutions in themes and plugins. We will focus on speed improvements that can be implemented on almost every website. These small fixes can make a really big difference in your page load time.
HTTP2 and GZIP
The first step is to have a properly configured hosting server. There are some basics that should be covered, like the HTTP/2 protocol, which introduces Multiplexing, allowing multiple files to be downloaded at the same time. The second important hosting setup is GZIP Compression, which can reduce the size of such assets like Javascript, CSS and HTML documents by up to 90%.
Fast TTFB
Time to First Byte (TTFB) is the time it takes for the browser to receive the first byte of page content. It’s basically the waiting time for MYSQL and PHP to execute template code. It’s not a rare case when some WordPress plugin is poorly written and includes a function with slow SQL queries or a PHP function that adds additional seconds to the total TTFB waiting time. The solution is to identify the “bad apple” and get rid of it.
Excluding GTM
The Google Tag Manager, which is widely used for deploying marketing tags, can often disturb the overall overview of site performance. The bare GTM script does not cause performance problems itself, but a lot of tags added to GTM can. Additional tracking scripts / HotJar javascripts or onload js functions configured into your GTM can cause performance bottlenecks. Having GTM scripts included in performance reports will disturb the results and hide potential areas for improvement.
We’ve just started our optimizations, so it’s probably not a good moment for negotiations with your marketing team about the amount of the needed tags. Instead, let’s just exclude www.googletagmanager.com/gtm.js from loading when the Page Speed Crawler or Lighthouse Crawler visits our site for measurements.
<!-- Google Tag Manager -->
<script>
    if(! navigator.userAgent.match(/nsights|ighth|gtmetrix/i)){
        (function (w, d, s, l, i) {
            w[l] = w[l] || [];
            w[l].push({
                'gtm.start': new Date().getTime(), event: 'gtm.js'
            });
            var f = d.getElementsByTagName(s)[0], j = d.createElement(s), dl = l != 'dataLayer' ? '&l=' + l : '';
            j.async = true;
            j.src = 'https://www.googletagmanager.com/gtm.js?id=' + i + dl;
            f.parentNode.insertBefore(j, f);
        })(window, document, 'script', 'dataLayer', 'ABC123');
    }
</script>
<!-- End Google Tag Manager -->
Load Third-party Javascripts on demand
To add extra widgets / features to a website, a common solution is to use external services. Adding a new chat widget, contact form or tracking script is really easy: just paste a couple of lines of javascript code to the page HEAD and enjoy the working component. Unfortunately, these components fetch scripts from external domains and load them Client-side. Such scripts will increase the ‘Fully Loaded Time‘ metric.
The solution to third-party scripts will be to avoid loading them initially, but only on demand. We can wait for user interaction with the website, like scrolling to a section, clicking a button or moving the mouse cursor, and only then initialize a part of the javascript responsible for the dynamic widget.
Here is an example of Facebook Chat (FB Messenger) javascript code. The customer chat is added to the website, which is a convenient way to contact customer support. We’re using scrollMonior ( https://github.com/stutrek/scrollmonitor ). It’s lightweight and fast, written in vanilla javascript. It uses watchers, which can determine if a certain page section entered user viewport.
In this particular example, we’re waiting until the user scrolls down to the footer and then load Facebook Chat. The second event to trigger the chat is clicking the “Facebook Chat Button” located in the page header ( .chat-fb class ).
var ctFBChatLoaded = false;
var myElement = document.getElementById("footer-start");
if (typeof (myElement) != 'undefined' && myElement != null) {
   // exists.
   var elementWatcher = scrollMonitor.create(myElement);
   elementWatcher.enterViewport(function () {
      if (!ctFBChatLoaded ) {
         ctLoadFBChat();
      }
   });
}
function ctLoadFBChat(){
   if(!ctFBChatLoaded){
      window.fbAsyncInit = function() {
         FB.init({
            xfbml            : true,
            version          : 'v11.0'
         });
      };
      (function(d, s, id) {
         var js, fjs = d.getElementsByTagName(s)[0];
         if (d.getElementById(id)) return;
         js = d.createElement(s); js.id = id;
         js.src = 'https://connect.facebook.net/en_US/sdk/xfbml.customerchat.js';
         fjs.parentNode.insertBefore(js, fjs);
      }(document, 'script', 'facebook-jssdk'));
      ctFBChatLoaded = true;
   }
}
jQuery('.chat-fb').on('click',function(){
   ctLoadFBChat();
   FB.CustomerChat.showDialog();
});
Defer Javascripts and ansync CSS
Render blocking resources, such as .js and .css files, cause the browser to wait. DOM can only be processed after the files are downloaded. The solution will be to add the defer attribute to javascripts: the loading order will still be intact, but not render-blocking anymore. The Async attribute can be added to “independent” scripts, which are not “connected” to other scripts and do not require a specific loading order, ex: GTM, FB pixel, FB chat.
In WordPress, we should exclude jQuery from defer loading. A lot of plugins / custom code require jQuery to be loaded first, so we will just keep the wp-includes/js/jquery/jquery.min.js file untouched.
For ‘asynchronous wp css loading’ there is a clever technique. Initially, the media parameter is set to “print”, and it changes to “all” on file load. It’s also good to add a preload tag for faster .css file loading.
Need practical tips for making Javascripts load as defer and CSS as async in WordPress? We have a separate blog post about it: WordPress async JS and CSS loading
Cumulative Layout Shift (CLS)
Google defined new metrics called Core Web Vitals, which are used to determine overall user experience. CLS – Cumulative Layout Shift – will return a good score if elements are not moving / not shifting during page load. How to achieve a stable position of elements during initial load? Make sure that CSS styles that are needed for above-the-fold content are loaded as fast as possible.
Animations are another cause of bad CLS score. Nice features, such as the Image Carousel with autoplay option enabled or a progress bar with CSS transitions that make the bar grow, will cause layout shifting.
Elements added via Javascript (dynamic JS snippets initialized on-load which insert HTML into the DOM) should be replaced with raw HTML. If not, at least load them as fast as possible (do not wait for event on-load).
How to measure Page Speed
We’ve added a couple of tweaks to our website. In theory, they should bring a major improvement in user experience and total load time. To know for sure, we need to use tools for testing website speed. A good way to start is to run a couple of tests using Lighthouse, it’s an open-source tool promoted by Google.
My recommendation will be to only measure “mobile performance”. Currently, the average mobile internet connection is – Latency: 150ms, Throughput: 1.6Mbps down / 750 Kbps up. It represents the the bottom 25% of 4G connections and the top 25% of 3G connections. Lighthouse currently calls this mode “Slow 4G”, it was previously called “Fast 3G”. It also applies throttling level to Computer Processor Power by simulating the CPU Slowdown Multiplier (x4), which represents a mid-tier mobile device.
When focusing only on mobile performance results, our results for Desktop should also improve. In addition, it’s a lot easier to get a good score on Desktop than on Mobile.
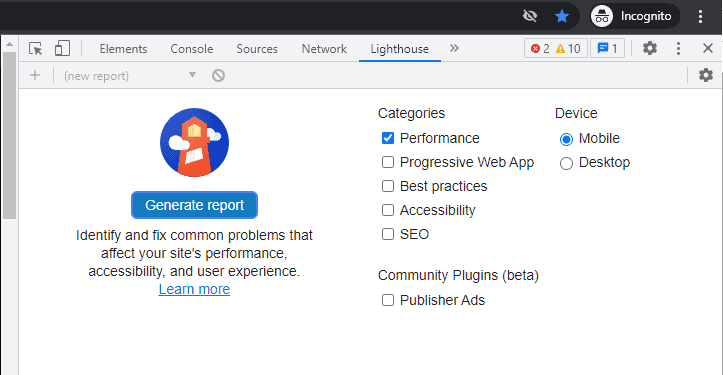
The first tool that can instantly scan our website / localhost domain is the Chrome Dev Tool – Lighthouse Tab. Run it in incognito mode of the browser, as it does not load browser extensions and results are more precise. Measurements can vary depending on connection speed and other random variables, but it’s a useful tool for checking if recent fixes / performance optimizations on the website are giving any boost in Google page score number.
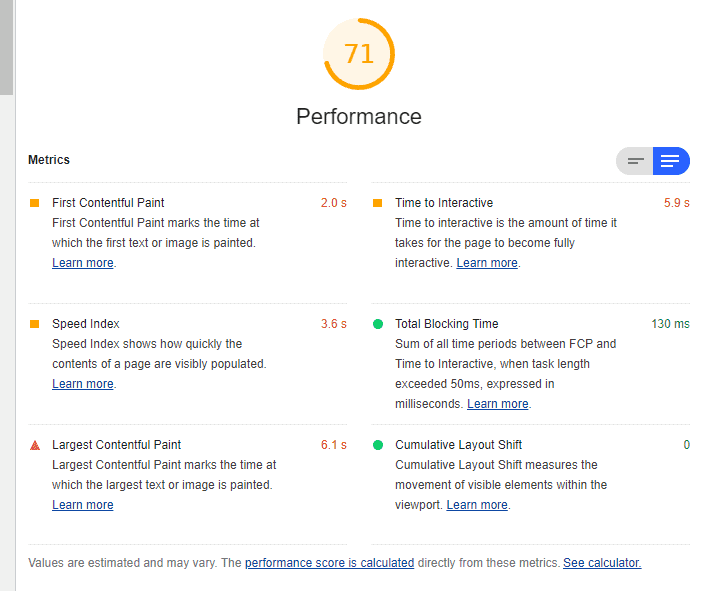
Open the Chrome Developer Toolbar (F12), click the Lighthouse Tab, choose ‘Performance’, Device ‘Mobile’ and ‘Generate report’. It simulates a mobile device to give us the overall estimation of metrics. The scores should be a good baseline for your current page speed, or at least an indicator of the direction code optimizations are heading.
Real User experience
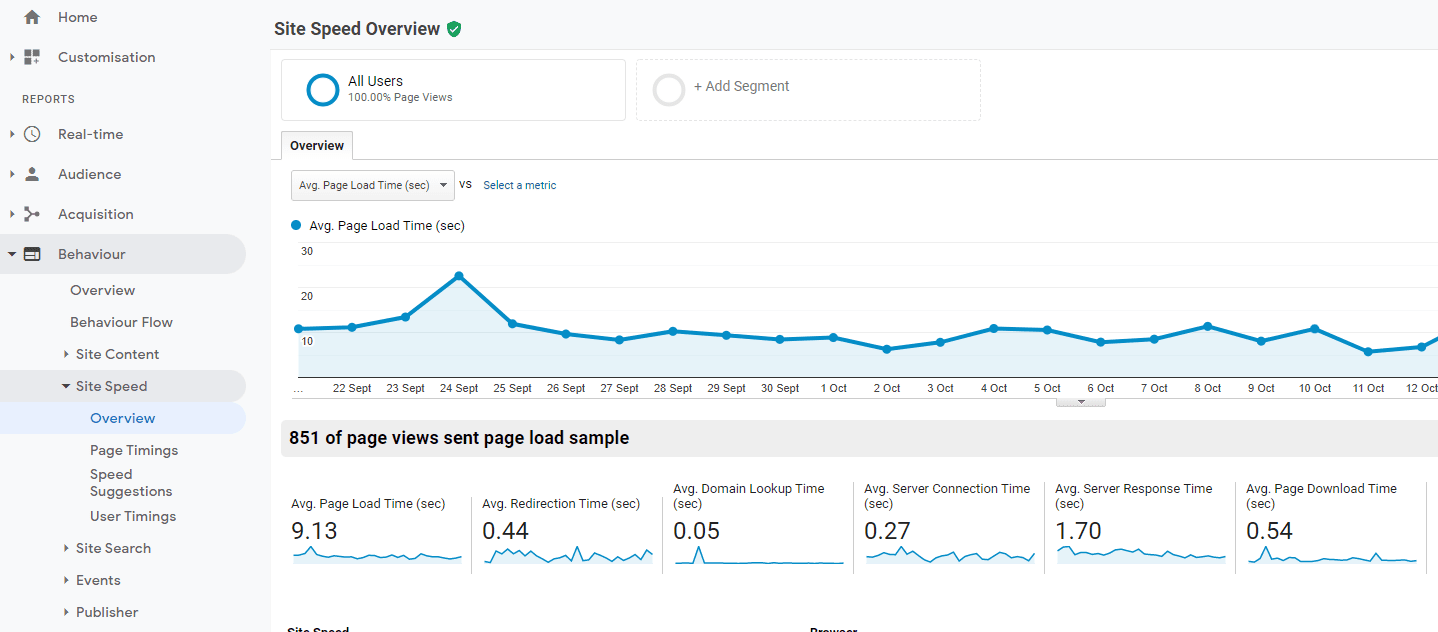
Eventually, we would like to improve our Client’s experience with the site. Installing a tool for gathering real page time load data is the recommended way for getting insights about the impact of our improvements. Google Analytics / Behaviour / Site Speed – Overview – is the section in GA that will show average Page Load Time. It’s useful for monitoring performance changes.
New Relic
Another useful tool for analyzing performance data is NewRelic. The APM view shows Web transaction time, including: PHP, MYSQL and Web Externals. The NewRelic service can be integrated with almost every website by installing Agent on the server. It monitors all real user sessions and provides interesting insights into speed metrics.
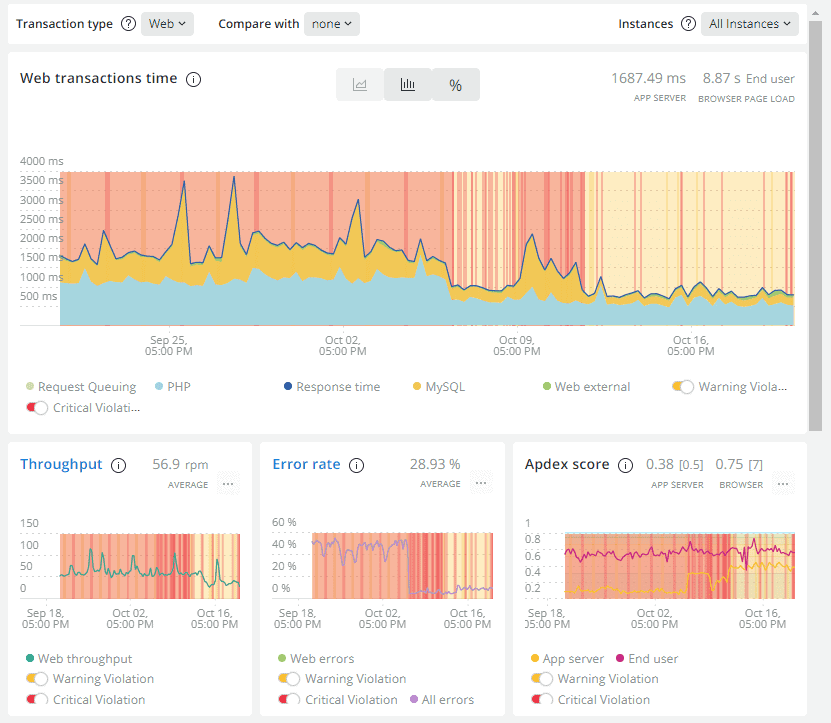
Another view worth checking out is Browser (Browser applications / Summary). The graph shows Page view load time, throughput and apdex. You can query results from the last 30 minutes, or even the last 7 days. It’s important to mention that the graph represents the average for all subpages, and all visitors around the world.
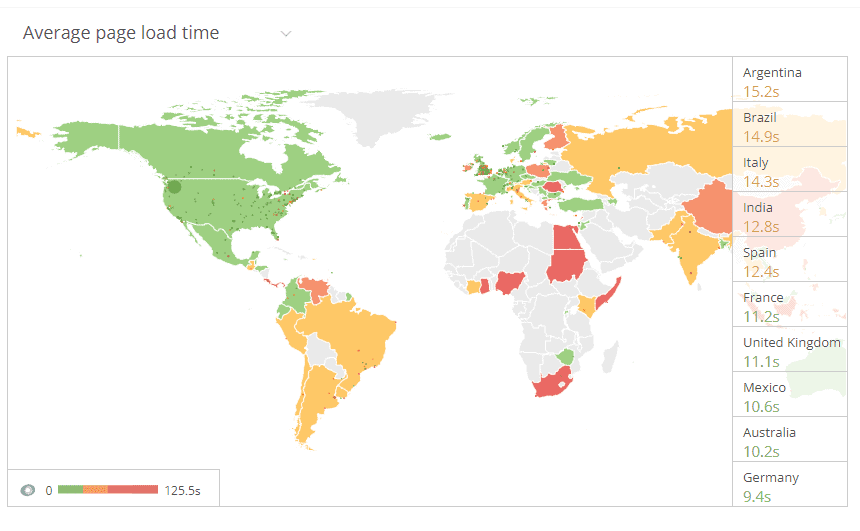
To have a better understanding of how user experience looks in certain parts of the world, we can use the “Filterable geography” view in NewRelic: the average page load time will be split by countries. We can even filter different metrics, such as Backend, Network, DOM processing or DNS lookup values.
GTmetrix
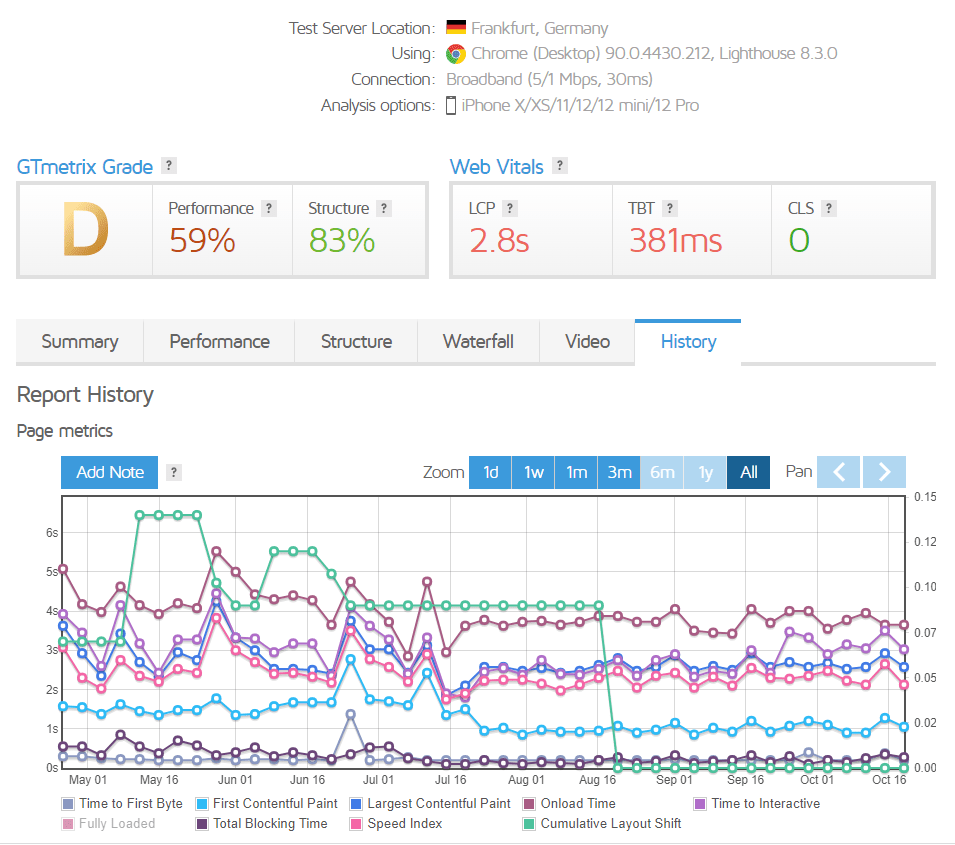
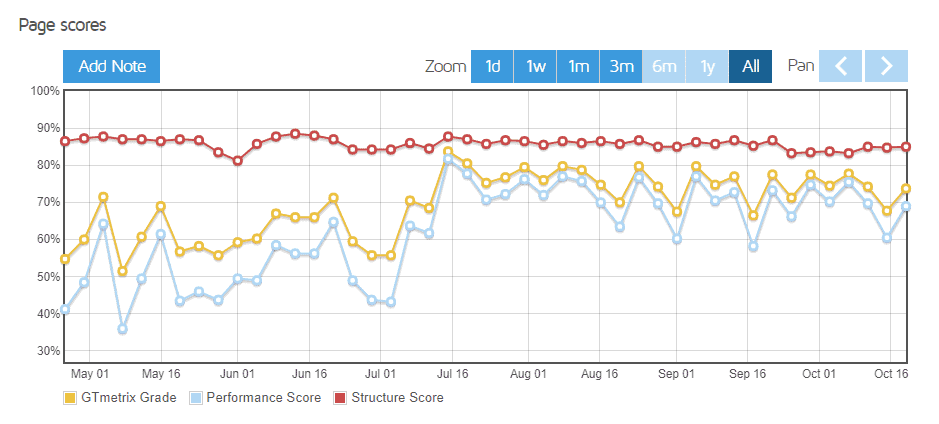
It’s a speed testing service that uses the Google Lighthouse engine. You can schedule site monitoring for Gtmetrix to analyze performance every day. The History tab will show changes in metrics and the current value for GooglePageSpeed Score.
The recommended settings for GTmetrix monitoring are:
Test Server Location: choose the nearest country where your Clients live
Connection: Broadband (5/1 Mbps, 30ms)
Analysis options: iPhone X/XS/11/12/12 mini/12 Pro
Block URL:
https://www.googletagmanager.com/*
https://www.google-analytics.com/*
https://connect.facebook.net/*
Google Search Console
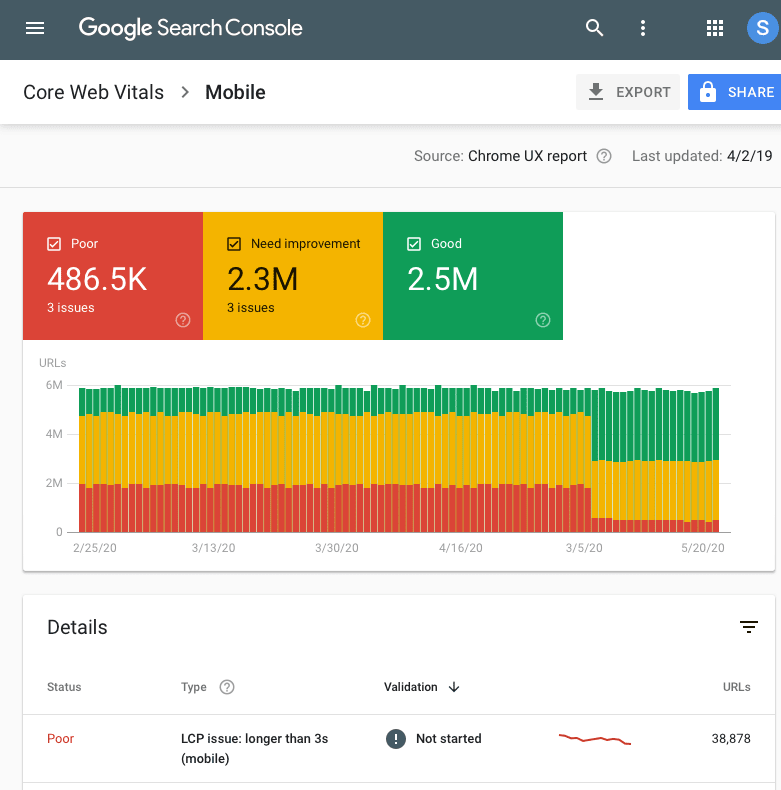
The last honorable mention is Google Search Console. The Experience section includes tips for usability improvements, Core web vitals reports and possible issues detected on subpages. Although the data can be interesting, the source of it is limited. Google Search Console takes measurements only from the Chrome UX report: “The Chrome User Experience Report is powered by real user measurement of key user experience metrics across the public web, aggregated from users who have opted-in to syncing their browsing history, have not set up a Sync passphrase, and have usage statistic reporting enabled”. My advice will be to first look at other performance tools, and leave Google Search Console for final tweaks.
Be patient
Optimizations are a process and rarely all metrics turn green overnight. Do not expect big real-time improvements, but rather think about it as a “project for the next 3-6 months”. Schedule an “optimization budget” in hours for every month and use this time for WordPress tweaks, analyzing graphs and metrics.
Interested in enhancing your site’s performance? Learn more by exploring our article on the async plugin WordPress.
When all “basic optimizations” are covered, the site will gain a certain good level of speed. Then, we can work on other “micro improvements” to target the remaining performance issues. It’s amazing how small fixes can have a big impact on general PageSpeed Mobile Score. It’s not a rare case when disabling geolocation in WooCommerce settings, adding certain resource-blocking javascript as preload tag, or removing the “Most popular posts” widget (which is responsible for inefficient DB queries) give the website a big speed boost.
Page speed affects SEO (ranking in search-results) and studies showed that better performance provides better conversion. Certainly, this is an investment worth our time.
That’s it for today’s guideline. Make sure to follow us for other useful tips and recommendations.


Comments
0 response